[Exchange Monitoring]: Introduction to Managed Availability (Part 3)


Now that you’ve finished Part I of my three part Managed Availability blog series, I will now go a bit deeper and provide some examples about the functionality and operability of Managed Availability. My virtual test lab contains a two-member DAG based on Windows Server 2012 and Exchange 2013 CU6.
Identify Unhealthy Health Sets and their error description. To get the server state, run the following cmdlet within the Exchange Management Shell:
Get-HealthReport -Server <SERVERNAME> | where {$_.alertvalue -ne "Healthy" –and $_.AlertValue –ne "Disabled"}
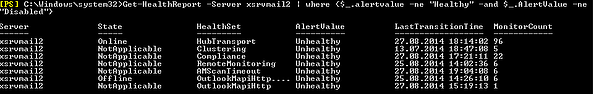
This cmdlet shows multiple HealthSets, which are Unhealthy. In this example, let’s take a look at the HealthSet Clustering, which has 5 Monitors.
Note: the property "NotApplicable" shows whether Monitors have been disabled by Set-ServerComponentState for their component. Most Monitors are not dependent on this, and thereby report "NotApplicable." Because the Clustering HealthSet has 5 Monitors, we check which Monitors are in an Unhealthy state:
Get-ServerHealth –Identity <SERVERNAME> -HealthSet <HealthSetName>
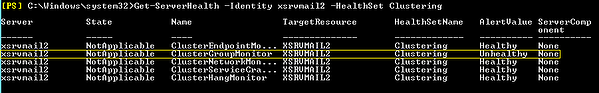
The Monitor ClusterGroupMonitor is in an Unhealthy state. To get all the information, especially the appropriate Probe, take a look at the Event Viewer in a readable outpout with the following cmdlet:
(Get-WinEvent -ComputerName <SERVERNAME> -LogName Microsoft-Exchange-ActiveMonitoring/MonitorDefinition | % {[XML]$_.toXml()}).event.userData.eventXml | ? {$_.Name -like "*<MonitorName>*"}
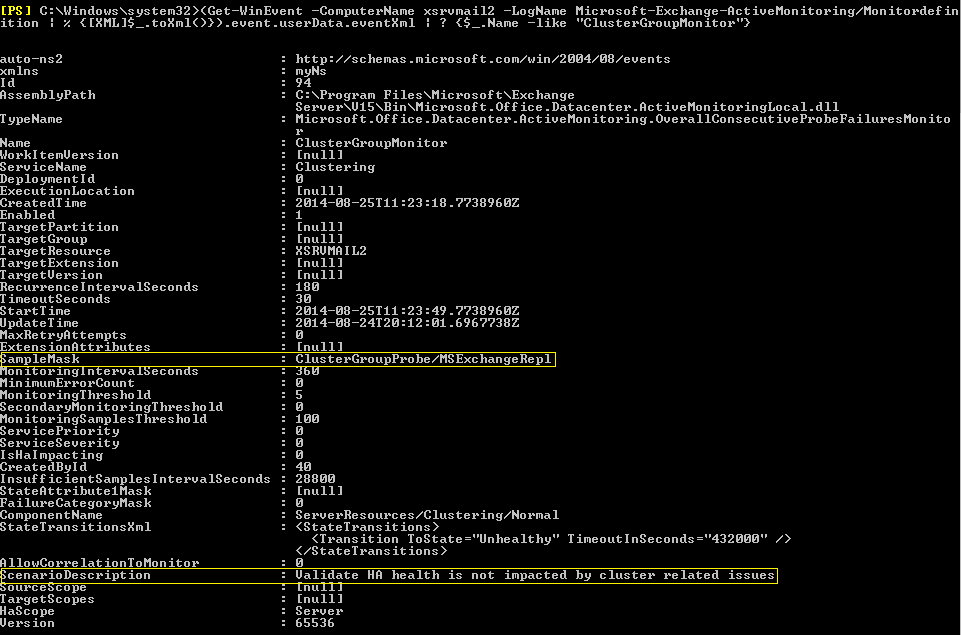
This output has two important values to identify the “real problem” of the Clustering HealthSet:
SampleMask: defines the appropriate substring that the Probe ClusterGroupProbe for the Monitor ClusterGroupMonitor “ClusterGroupProbe\MSExchangeRepl“ have in their name
ScenarioDescription: shows more information about the issue
From the output above, we found that Validate HA health is not impacted by cluster related issues and therefore wants to fix it.
You can retake some Probe checks with the cmdlet Invoke-MonitoringProbe <HealthSetName>\<ProbeName> -Server <SERVERNAME> | fl
Note: For reference, you can take a look at the Exchange 2013 Management Pack Health Sets. Important: this cmdlet is only available if your Exchange servers are configured for time zones UTC and UTC-. The cmdlet doesn’t work with time zones UTC+ (hopefully Microsoft will fix this issue in the near future).
Let’s take a further look at the Probe configuration for the ClusterGroupProbe: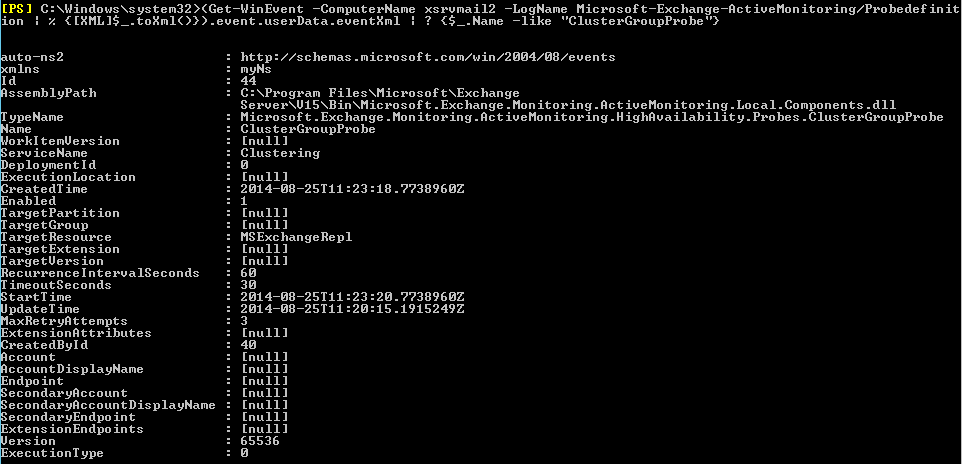
The next step is to identify the complete error message so that every administrator knows what he or she has to do:
$Errors = (Get-WinEvent -ComputerName <SERVERNAME> -LogName Microsoft-Exchange-ActiveMonitoring/ProbeResult –FilterXPath "*[UserData[EventXML[ResultName=‘<ProbeName>/<TargetResource>'][ResultType='4']]]" | % {[XML]$_.toXml()}).event.userData.eventXml
$Errors | select -Property *time,result*,error*,*context
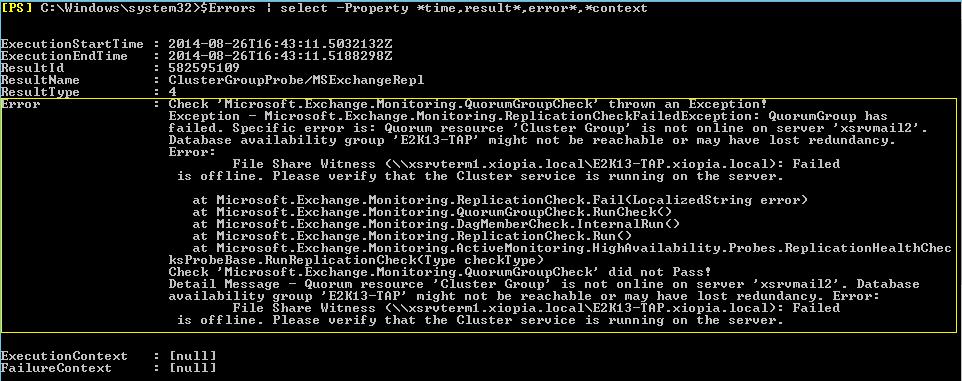
Result: the quorum resource “Cluster Group” is not online on server “xsrvmail2.“ Database Availability Group “E2K13-TAP” may not reachable or may have lost redundancy.
Why could Managed Availability solve this issue not of itself?
Managed Availability is a “self-healing” component of Exchange 2013. As described in the steps above, responders are responsible for trying to repair the Exchange organization on its own without any administrator impact. Let’s take a look which Responders are relevant for the Unhealthy Clustering HealthSet:
To display all Probes, Monitors, and Responders of the HealthSet Clustering, run the following cmdlet in the Exchange Management Shell:
Get-MonitoringItemIdentity –Identity <HealthSetName> –Server <SERVERNAME> | ft name,itemtype,targetresource –AutoSize
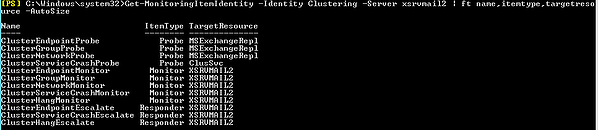
You can see 3 Escalate Responders, based on the “Name” attribute:
ClusterEndpointEscalate
ClusterServiceCrashEscalate
ClusterHangEscalate
To identify the correct Responder for our Monitor ClusterGroupMonitor, run the following cmdlet in the Exchange Management Shell:
$DefinedResponders = (Get-WinEvent –ComputerName <SERVERNAME> -LogName Microsoft-Exchange-ActiveMonitoring/ResponderDefinition | % {[xml]$_.toXml()}).event.userData.eventXml
$DefinedResponders | ? {$_.AlertMask -like “*<MonitorName>*”} | fl Name,AlertMask,EscalationSubject,EscalationMessage,UpdateTime
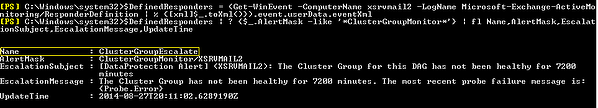
As you can see in the screenshot above, the appropriate Responder called ClusterGroupEscalate with the parameter Name, AlertMask, EscalationSubject, EscalationMessage, and UpdateTime.
Remember: Escalate Responders writes an entry in the Event Viewer to inform an administrator. This means that any issues with the HealthSet Clustering cannot be recovered automatically through Managed Availability.
For completeness, let’s make an example with the HealthSet OWA.Protocol:
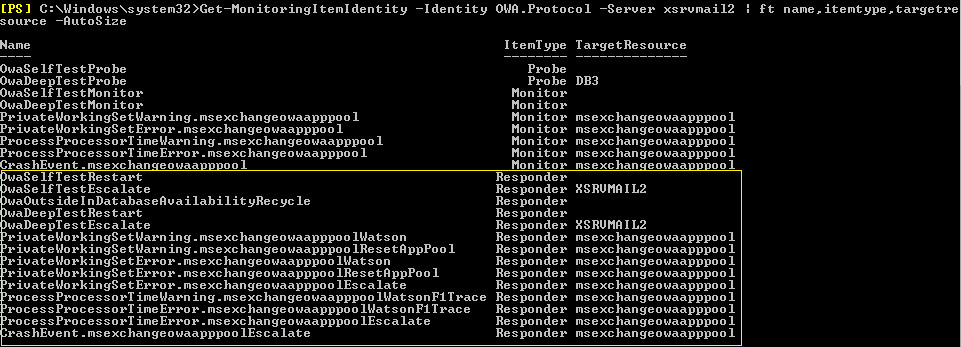
As you can see in the screenshot above, there are much more Responder types for the HealthSet Clustering.
To identify the correct Responder for our Monitor OwaSelfTestMonitor with all necessary information, run the following cmdlet:
$DefinedResponders = (Get-WinEvent –ComputerName <SERVERNAME> -LogName Microsoft-Exchange-ActiveMonitoring/ResponderDefinition | % {[xml]$_.toXml()}).event.userData.eventXml
$DefinedResponders | ? {$_.AlertMask -like “*<MonitorName>*”} | fl Name,AlertMask,EscalationSubject,EscalationMessage,UpdateTime
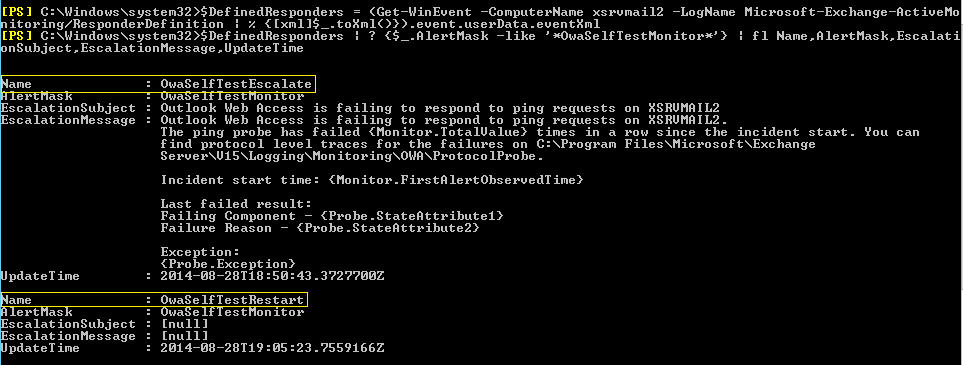
You can see two Responders:
OwaSelfTestEscalate: ping request failed and an administrative intervention is needed (Escalate)
OwaSelfTestRestart: this Responder carried out a recovery action (but what exactly?)
To find out the recovery action from Responder OwaSelfTestRestart let’s grab all information about the Responder configuration:
(Get-WinEvent -LogName Microsoft-Exchange-ActiveMonitoring/ResponderDefinition | % {[XML]$_.toXml()}).event.userData.eventXml | ?{$_.Name -like "*<ResponderName>*"}
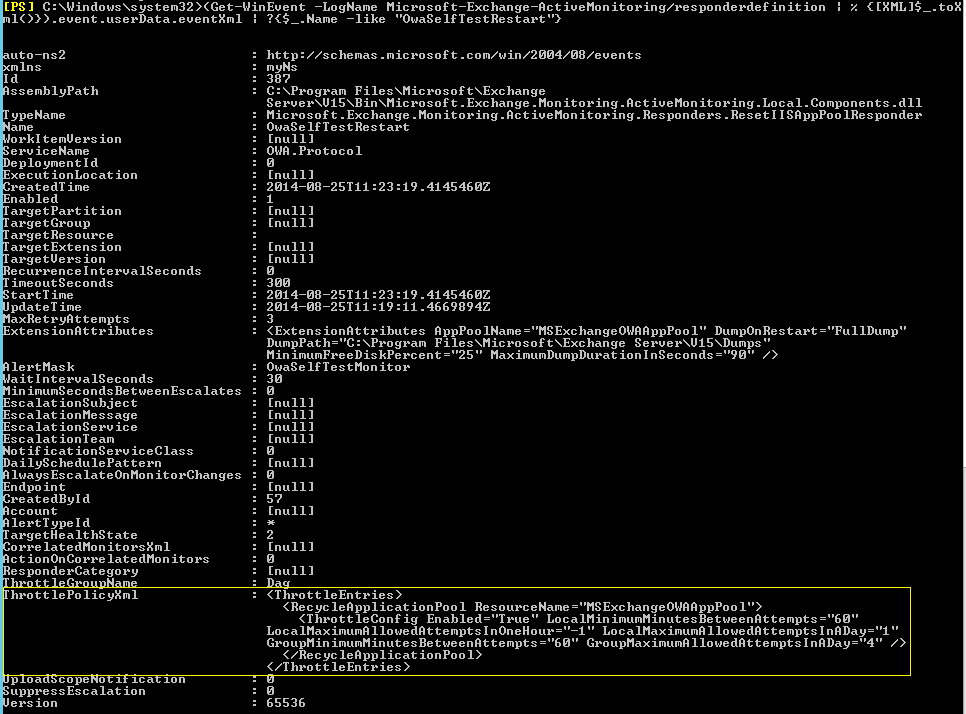
As you can see at the parameter ThrottlePolicyXml, which is customizable, there are some Responder definitions:
RecycleApplicationPool “MSExchangeOWAApPool” is self-explanatory
ThrottleConfig Enabled: if the ThrottlePolicyXml is enabled (True) or disabled (False)
LocalMinimumMinutesBetweenAttempts: how many actions can be taken on this server within the defined timeframe
LocalMaximumAllowedAttemptsinOneHour: how many actions can be taken on this server within one hour
LocalMaximumAllowedAttemptsinADay: how many actions can be taken on this server within one day
GroupMinimumMinutesBetweenAttempts: how many actions can be taken in the DAG or array within the defined timeframe
GroupMaximumAllowedAttemptsInADay: how many actions can be takten in the DAG or array within the defined timeframe
Next, you should take a look at the Microsoft-Exchange-ManagedAvailability/RecoveryActionResults crimson channel for entries. Event 500 indicates that a recovery action has begun, event 501 indicates that the action was taken has completed, and event 501 indicates that the action threw an error.
Note: you have a better overview if you go directly into the Event Viewer in the log name Microsoft-Exchange-ManagedAvailability/RecoveryActionResults. For specific troubleshooting, I prefer the Exchange Management Shell.
$RecoveryActionResults = Get-WinEvent -ComputerName <SERVERNAME> -LogName Microsoft-Exchange-ManagedAvailability/RecoveryActionResults
$XML = ($RecoveryActionResults | Foreach-object –Process {[XML]$_.toXml()}).event.userData.eventXml
$XML | Where-Object {$_.State -eq "Finished" -and $_.RequestorName -eq "OwaSelfTestRestart"}
Note: you can filter your log to the current day if there are too many items logged. It’s easy to use the parameter EndTime, such as the following cmdlet: $XML | Where-Object {$_.State -eq "Finished" -and $_.EndTime -like "2014-08-28T18*" -and $_.RequestorName -eq "OwaSelfTestRestart"} RequestorName = your appropriate Responder, such as “OwaSelfTestRestart”
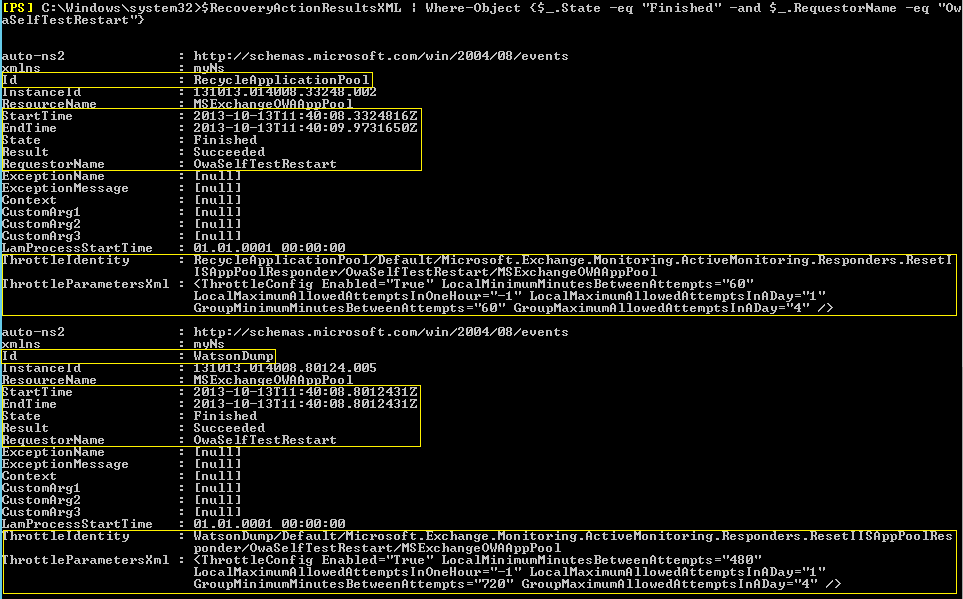
The screenshot above demonstrates two different recovery actions:
For a general overview of all recovery actions, take a look at the Microsoft-Exchange-ManagedAvailability/RecoveryActionsLog crimson channel:
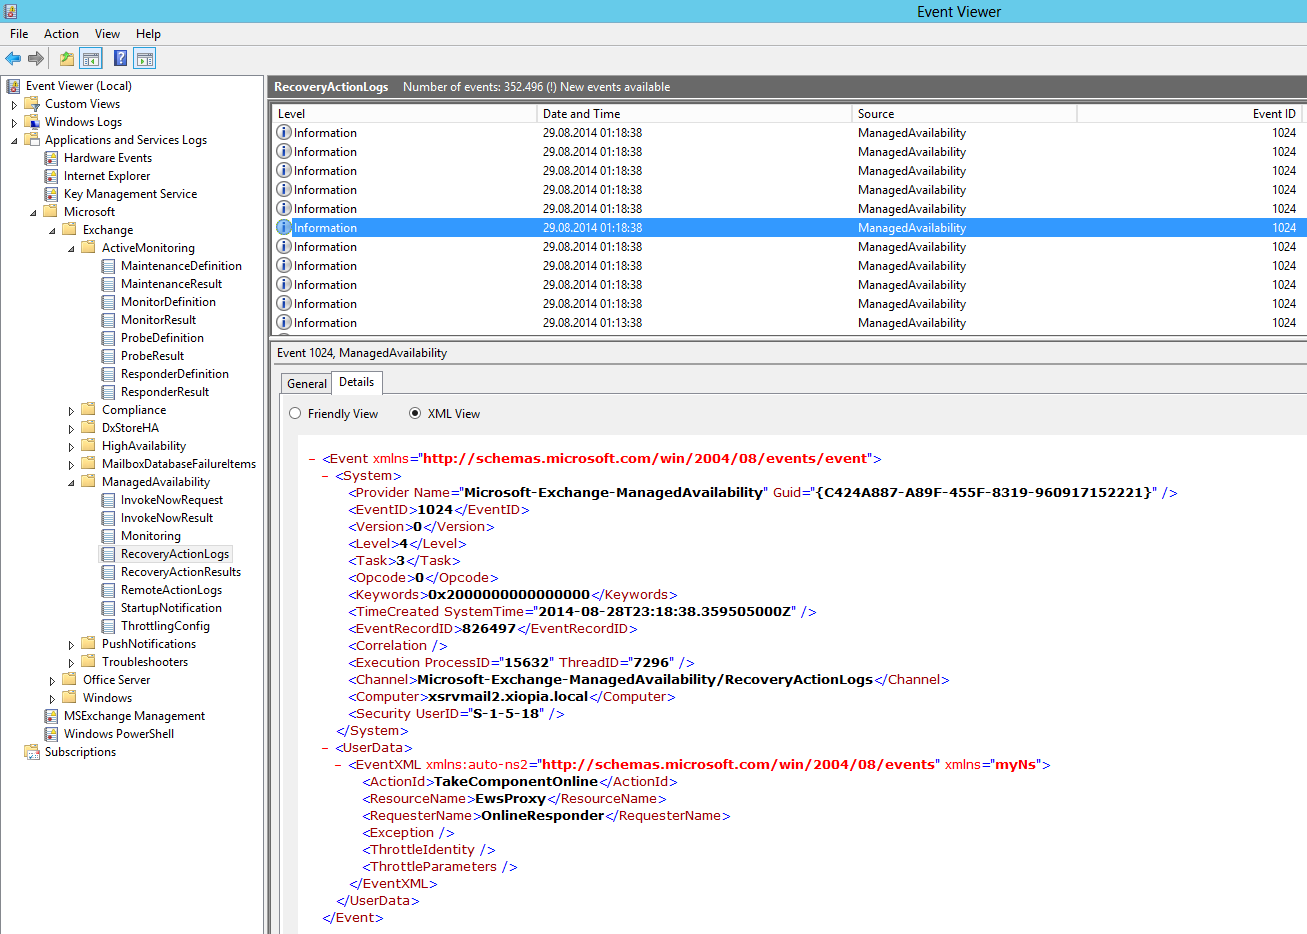
I prefer to use the Event Viewer because it is clearer. But for those who like to search for specific recovery actions or at an individual time, feel free to use the Exchange Management Shell and create your own additional filters if you need it:
$RecoveryActionLogs = Get-WinEvent -ComputerName <SERVERNAME> -LogName Microsoft-Exchange-ManagedAvailability/RecoveryActionLogs
$XML = ($RecoveryActionLogs | Foreach-object –Process {[XML]$_.toXml()}).event.userData.eventXml
$XML | Where-Object {$_.State -eq "Finished" -and $_.RequestorName -eq "OwaSelfTestRestart"}
In Part 3 we dive into local monitoring and overrides.
Watch all aspects of your Exchange environment from a single pane of glass: client access, mailbox, and Edge servers; DAGs and databases; network, DNS, and Active Directory connectivity; Outlook, ActiveSync, and EWS client access.


Disk space is vital to the health of an Exchange Server. Without disk, you don’t have email, thus ...